Have you ever wondered why some football teams consistently perform better than others? One significant factor is the amount of money they spend on player wages. For the first time ever the three teams promoted last year were relegated this year: Sheffield United, Burnley, and Luton Town. Using data from the British Premier League, we will explore how a team’s wage expenditure influences its league rank. We’ll also examine how this financial investment can make the difference between staying in the league and facing relegation.
The Data
To understand this relationship, we analyzed data from the 2023-2024 season, which included the league positions and wage ranks of various teams. The wage rank indicates how much teams spend on player wages compared to others, with a lower rank meaning higher spending.
| team_name | league_position | rank |
|---|---|---|
| Manchester City FC | 1 | 1 |
| Arsenal FC | 2 | 3 |
| Liverpool FC | 3 | 5 |
| Aston Villa FC | 4 | 6 |
| Tottenham Hotspur FC | 5 | 7 |
| Chelsea FC | 6 | 4 |
| Newcastle United FC | 7 | 9 |
| Manchester United FC | 8 | 2 |
| West Ham United FC | 9 | 8 |
| AFC Bournemouth | 12 | 15 |
| Fulham FC | 13 | 12 |
| Wolverhampton Wanderers FC | 14 | 17 |
| Brentford FC | 15 | 16 |
| Everton FC | 16 | 10 |
| Nottingham Forest FC | 17 | 13 |
| Luton Town FC | 18 | 20 |
| Burnley FC | 19 | 18 |
| Sheffield United FC | 20 | 19 |
Visualizing the Relationship
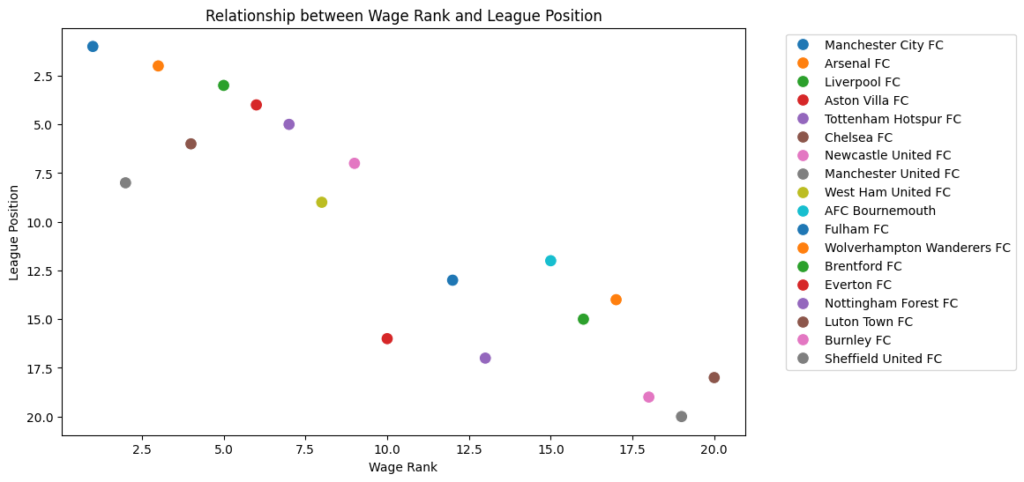
First, we created a scatter plot to visualize the relationship between wage rank and league position. Each point represents a team, with the wage rank on the x-axis and the league position on the y-axis.

The scatter plot shows a clear trend: teams that spend more on wages (lower wage rank) tend to finish higher in the league. This suggests a strong link between financial investment in player wages and team performance.
Statistical Analysis
We calculated the correlation coefficient to quantify this relationship, which measures how closely two variables are related. The correlation coefficient for our data is approximately 0.90, indicating a very strong positive relationship. In simpler terms, as teams spend more on wages, their league positions tend to improve significantly.
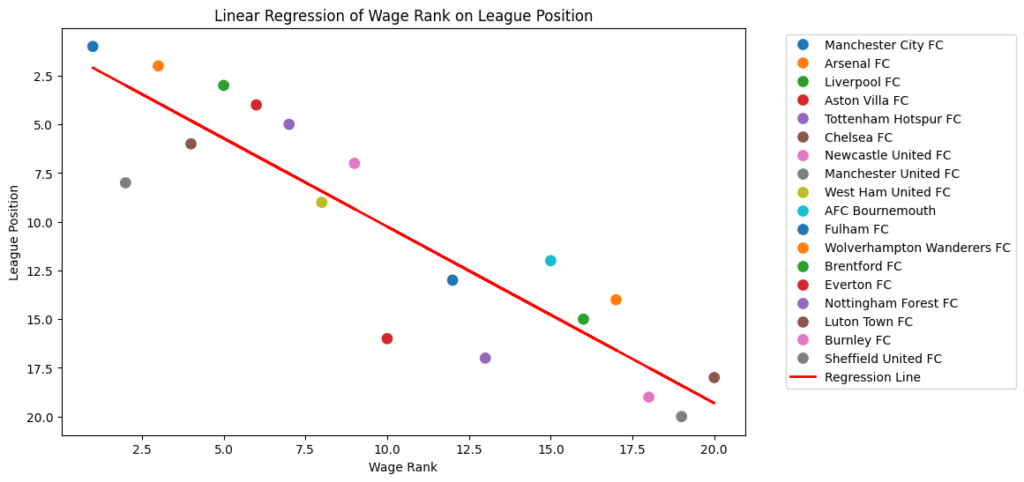
Additionally, we performed a linear regression analysis to predict league positions based on wage rank. The regression line (shown in red on the scatter plot below) further confirms that higher spending on wages is associated with better league performance.

The Impact of Wages on Relegation
A crucial aspect of this analysis is understanding the impact on teams at the bottom of the league. Our data shows that the three teams with the lowest wage expenditures were also relegated from the league. This highlights the stark reality that insufficient investment in player wages can lead to poor performance and relegation.
Pay to stay
Our analysis provides clear evidence that wages significantly impact football league performance. Teams that invest more in player wages tend to achieve higher league positions, while those that spend less face the risk of relegation.
This underscores the importance of financial investment in building a competitive team for fans and club management alike. As the saying goes, “You get what you pay for,” in football, this often means that higher wages lead to better performance on the pitch.
More work to be done
In future articles, I’m going to examine the relegated teams and the top teams in the league further and how wages impact this by position, value per point and wages spent, value of goals and wages spent, and finally, predicting league position based on these factors.
Feel free to share your thoughts in the comments or things you’d like to see analyzed! Let’s discuss!


